Step by Step procedure on How to Generate Flood Hazard Exposure Mapping in QGIS. Hope you will learn how to create any exposure mapping in GIS platform.

Flood Hazard Exposure Mapping in QGIS Complete Tutorial

Scope and Objectives of Flood Hazard Exposure Mapping
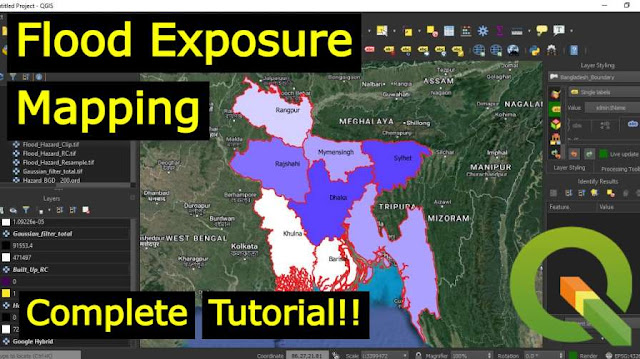
This tutorial walks you through each step of creating Flood Hazard Exposure Mapping in QGIS. Here one form of flood is considered that is riverine floods. The created map is displayed in Figure above and the explanation of the used methodology are provided below.
Methodology for Flood Hazard Exposure Mapping
We use a variety of geospatial approaches to modify data in order to determine the Identify the % of the population exposed to flood risk.
Data List with Resolution:
* Boundary of the study area
* Population data in Excel Format
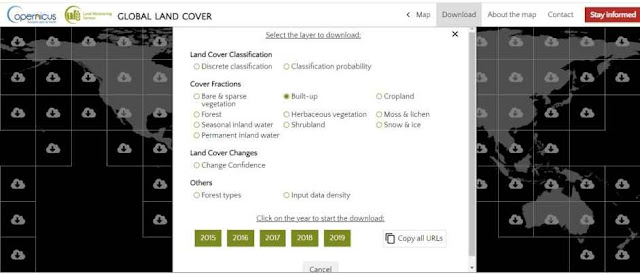
* Built Up Area Data (100m resolution)
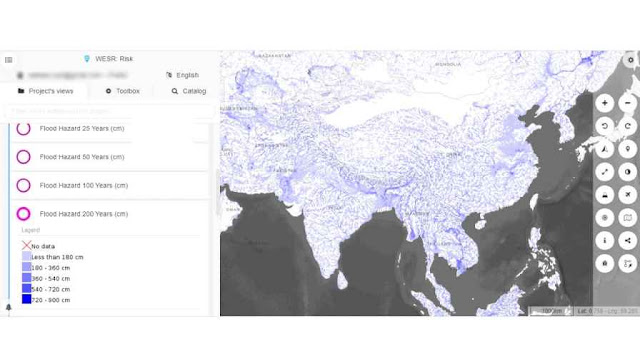
* Flood Hazard Data of 200 years of Return Period (1000m resolution)
For Practice at home. Find the data here: Flood Hazard Exposure Mapping
Step by Step Guideline for Flood Hazard Exposure Mapping
Download Most Stable Version of QGIS 3.10.2 HERE
[
| QGIS-OSGeo4W-3.10.2-2- | 2020-01-23 17:41 | 401M |
]
Step 1:
Add all data into QGIS. All data should be in same projection System . In this case all data are in EPSG 4326 WGS84 Geographic Projection System. Now clip the Built Up area using Clip Raster by Mask Tool in QGIS.
Download Administrative Boundary of ALL country from
a. DIVA GIS
DIVA GIS Download information on population density, land cover, altitude, and administrative boundaries for any country in the world.
b. HDX - - Humanitarian Data Exchange
An open data sharing platform. Find Social , Humanitarian , Administrative Boundaries for all country from here. Humanitarian Data Exchange
You can check this video on How to download Data from Humanitarian Data Exchange by Clicking on this Link:
Download data HDX (Humanitarian Data Exchange)
Step 2 :
Reclassify the clipped Built-up Area Data with the help of r.reclass tool in QGIS. 0 will be the Non- Built Up Area and 1 will be the Built Up Area.
Sometime you may face Problem to open this r.reclass tool. You can simply solve the problem of "This algorithm cannot be run :-( in QGIS"
This algorithm cannot be run :-( The specified GRASS 7 folder "C:\Program Files\QGIS 3.6\bin\bin" does not contain a valid set of GRASS 7 modules. Please, go to the Processing settings dialog, and check that the GRASS 7 folder is correctly configured
by following this simple method:
Just copy the whole folder named "bin" in this path "C:\Program Files\QGIS 3.10\apps\grass\grass78\bin" into the "C:\Program Files\QGIS 3.10\bin".
versions:
QGIS 3.10.2
Step 3 :
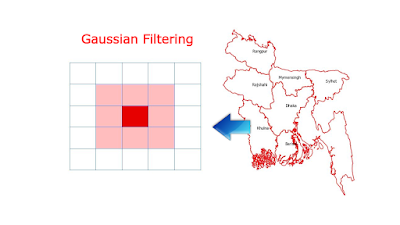
Apply Gaussian Filtering to the Reclassified Built Up Area data. It will be used later to estimate the population density of each Administration Boundary considering the characteristics of each Boundary area. This smoothing method helps to Transform density of Population into Normalized Value. Usually in the Built up area Population density is higher but land is limited. on the contrary Density is Lower at Non Built Up Area but there is plenty of Land. The grid's center is where the Accumulated built-up areas with the highest population density are located. The administrative boundary's allocated value decreases with distance from the center.
Here in the above picture , Pixel weight is high at the center of the boundary where consider more density of Population. Pixel weight is decrease as it far way from the center means at the corner where density of populations in considered less.Download Flood Hazard data of 25, 50,100,200,1000 year return period for all country free from the Link provide below;
View Flood Hazard data of different return period for All Country here
QGIS tool that will be frequently need in this analysis are Clip Raster by Mask, Reclassy Raster Tool, Gaussian Filtering, Resample Raster Data, Join field from Excel File into Shapefile Attribute Table, Rasterize Vector Layer using Vector to Raster Conversion Tool, Zonal statistics Tool, Raster Calculator to calculate population exposure to Flood, Percentage of affected Population. Hope you now able to make any Hazard Exposure Mapping with the help of free software QGIS

Find the FULL Tutorial of Flood Hazard Exposure Mapping in QGIS Step by Step HERE;
Keyword:
Other Tutorials:
Learning is thrilling because it allows you to discover new things. We can assist you whether you're new to GIS or a seasoned practitioner looking to try out the latest technologies.
List of popular tutorials
SL | Tutorial Name | Link |
1. | Free Spatial Data |Shapefile| of Any Country & Humanitarian Data | |
2. | Land Cover Data 10 m Resolution | |
3. | Least Cost Path | |
4. | Download Open Street Map | |
5. | Stream Power Index SPI Calculation | |
6. | Topographic Wetness Index TWI Calculation | |
7. | Suitability Analysis Using ArcGIS | |
8. | Add xy data from excel, clip, select, split, table select tools in ArcGIS | |
9. | Drainage or Stream Frequency & Infiltration number | |
10. | Calculate Stream or Drainage Density | |
11. | Extracting Stream or Drainage Network from DEM | |
12. | Detail Watershed Delineation using DEM | |
13. | Change Detection | |
14. | Download Free Shapefile | |
15. | Download Soil Organic Carbon, Evapotranspiration, Land cover, Precipitation Data | |
16. | Human Influence Calculation | |
17. | Lineaments Extraction | |
18. | World Soil Map Shapefile | |
19. | Hotspot / Kernel Density Analysis | |
20. | GIS Shapefile Data (Road, Structure, etc.) for Any Country | |
21. | Land Cover Change Detection | |
22. | Soil Moisture Index and Land Surface Temperature Calculation | |
23. | Calculate normalized burn ratio (NBR) | |
24. | Create Specific & Random Points | |


